USCIS Backlog Data Shows Rising Delays And Denial Rates
New Dashboard Tracks USCIS Backlogs
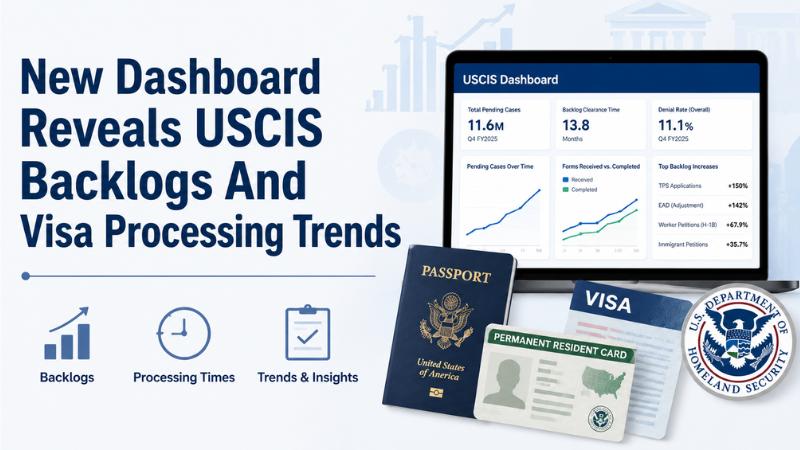
A new interactive dashboard from the American Immigration Council is giving the public a detailed look at USCIS backlogs, visa processing trends, filing volumes, and denial rates. The dashboard includes more than 20,000 data points covering over 190 immigration applications and petition types from fiscal year 2016 through fiscal year 2025.
The tool is designed to help applicants, employers, journalists, advocates, and policymakers better understand how the U.S. legal immigration system is handling growing demand.
Pending Cases Continue To Rise
According to the analysis, the USCIS backlog has more than tripled over the last decade. Pending cases increased from 3.5 million in the first quarter of fiscal year 2016 to 11.6 million by the fourth quarter of fiscal year 2025.
The backlog grew sharply during and after the COVID-19 period, when processing slowed, and new filings increased. By late 2025, USCIS would have needed an estimated 13.8 months to clear pending cases at its existing processing capacity.
TPS, EAD And Worker Petitions Affected
The dashboard shows major increases in several high-volume immigration categories. Pending Temporary Protected Status applications rose from 465,118 to nearly 1.2 million between late 2024 and late 2025. Pending employment authorization requests for green card applicants also more than doubled during the same period.
Worker-related petitions also saw increases, including non-immigrant worker petitions and immigrant worker petitions, highlighting continued pressure on employment-based immigration processing.
Denial Rates Remain High
The data also shows that USCIS denial rates remain elevated across several form types. Overall denial rates rose from 8.6 percent in early fiscal year 2016 to 11.1 percent by the fourth quarter of fiscal year 2025, after peaking at 14.9 percent in fiscal year 2022.
TPS applications, EAD requests, waiver applications, H-1B-related petitions, and family-based petitions were among the categories showing notable changes in denial trends.
Impact On Applicants And Employers
The dashboard highlights how delays and rising denial rates can create uncertainty for immigrants, families, employers, and workers. Longer processing times may affect employment, travel, legal status, and business planning.
The report suggests that USCIS continues to face major operational pressure as application volumes increase. For applicants and employers, the data reinforces the need to track processing updates carefully and prepare documentation accurately before filing.